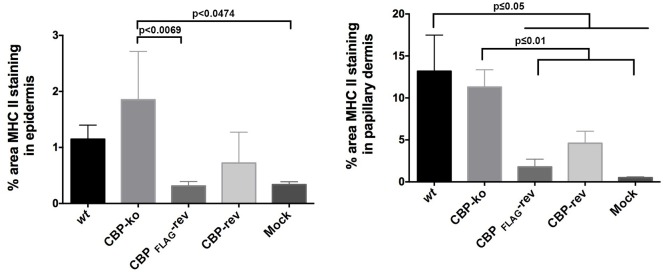
Figure 10.
MHC-II staining in the epidermis and papillary dermis. The percent area for MHC-II staining was determined using Image J Fiji. Biopsy tissue day 4 p.i., dose 107 p.f.u. virus and for mock infected (PBS). The data was analyzed by One Way ANOVA plus Sidoks test where N = 6 for wt, CBP-knockout (KO), CBP-FLAG revertant, and CBP revertant, that is one biopsy taken from each infected animal. N = 22 for mock infected (biopsies taken from animals across all 4 groups).

