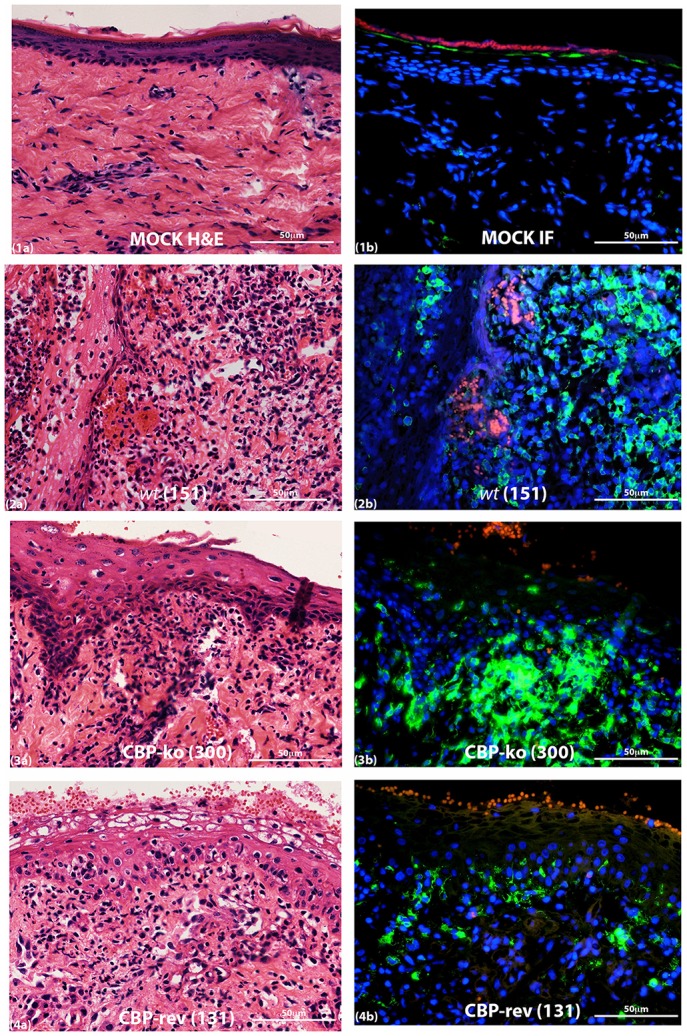
Figure 9.

MHC-II staining of ORFV infected skin tissue and mock infected. Biopsy tissue day 4 p.i., dose 107 p.f.u. virus. Adjacent sections for H & E (a) and MHC-II staining (b) are shown: (1) mock infected (PBS), (2) wt, (3) CBP-knock-out virus, (4) CBP revertant virus. MHC-II positive cells (green); cell nuclei (DAPI) (blue); non-specific staining of red blood cells (red). The images were taken at 40X magnification.
