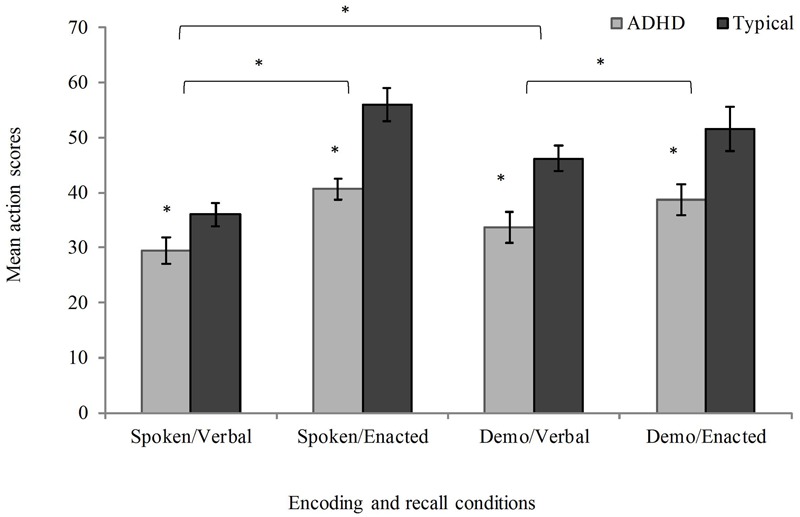
FIGURE 2.

Mean action scores (max 126; error bars represent standard errors) as a function of presentation and recall type in children with attention deficit hyperactivity disorder (ADHD) and typical developing children; Demo = Demonstration. ∗p < 0.05.
