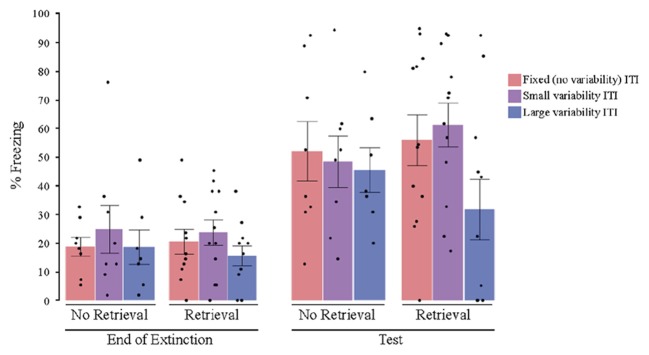
Figure 3.
Percent freezing at the end of extinction and post reinstatement for Experiment 2 (2-min average ITI). The results showed a variability by retrieval condition interaction. The group that received both a retrieval CS and highly variable ITIs showed less post reinstatement freezing, and also did not show a significant increase in freezing from the end of extinction to post-reinstatement test. All other groups showed significant increases in freezing from the end of extinction to test, with no significant differences among the groups. ITI, inter-trial interval; black dots represent individual data points.

