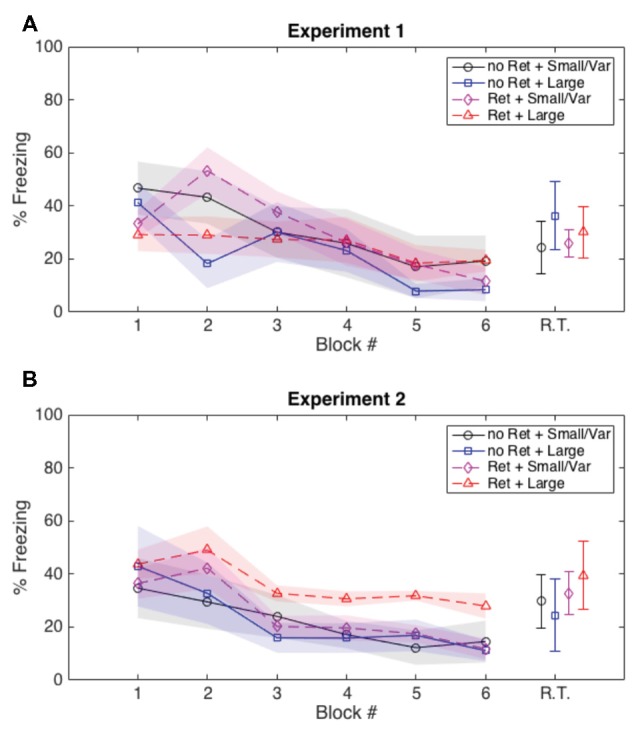
Figure 4.

Average freezing during the 20 s prior to each CS presentation during extinction and post-reinstatement test. (A) In Experiment 1 there were no group differences in pre-CS freezing during extinction or prior to the reinstatement test. (B) In Experiment 2, all groups showed similar pre-CS freezing during the first half of extinction, but the group that received the retrieval CS and highly variable ITIs showed more preCS freezing during the second half of extinction than the other groups, presumably due to uncertainty about when the CS would appear. These group differences in pre-CS freezing did not persist through reinstatement, and thus cannot be attributed to generalized freezing rather than a response to ITI variability. R.T., retrieval test; shaded areas and error bars: ±1 standard error of the mean; “Ret”, retrieval; “Large”, large variable ITI; “Small/Var”, small variable and fixed ITI.
