Fig. 2.
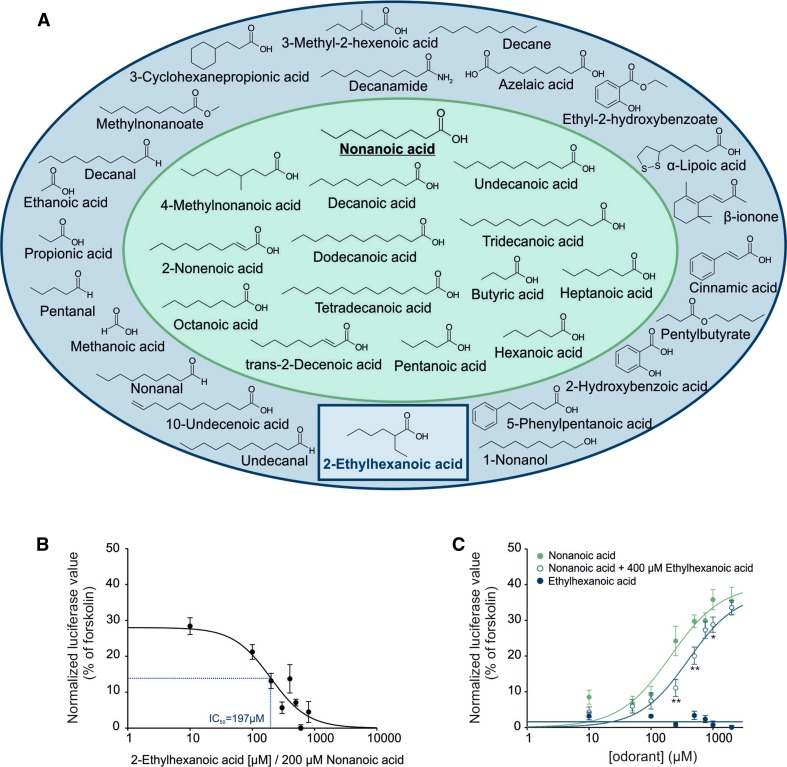
Ligand spectrum of OR51E1. a Molecular receptive field of OR51E1. Structurally related molecules were tested in luciferase reporter assays for their ability to activate heterologously expressed OR51E1, using nonanoic acid as a template. Effective ligands are shown in a green field; inactive compounds are in a blue field. Receptor-inhibiting substance is shown in a blue rectangle. The active analog approach identifies a mono carboxyl functional group as key feature for OR51E1 activation; alkyl side chain length can vary from C4 to C14; methyl substitutions are not tolerated at Cβ. Double bonds are tolerated at Cβ but affect negatively the activating property of the compound at Cκ (e.g., undecanoic acid: activating, 10-undecenoic acid: inactive). Aromatic functional groups are not tolerated. b Concentration–inhibition curve. Each response was normalized to the agonist nonanoic acid (200 µM) alone. The calculated IC50 was 192 μM. The curve shift was significant at concentrations higher than 100 µM 2-ethylhexanoic acid (*p < 0.05). c Dose–response curves in the presence of OR51E1 antagonist. To determine receptor-inhibiting properties of compounds, OR51E1-expressing cells were co-stimulated with a rising concentration of nonanoic acid and a fixed concentration of 2-ethylhexanoic acid (400 µM). The mean of cellular responses was measured by luciferase reporter assays in four biological replicates and normalized to the positive control (forskolin). 2-ethylhexanoic acid acts as a competitive inhibitor on OR51E1. Significance was calculated by Student’s t test (*p < 0.05, **p < 0.01 and ***p < 0.001). Error bars represent the SEM

