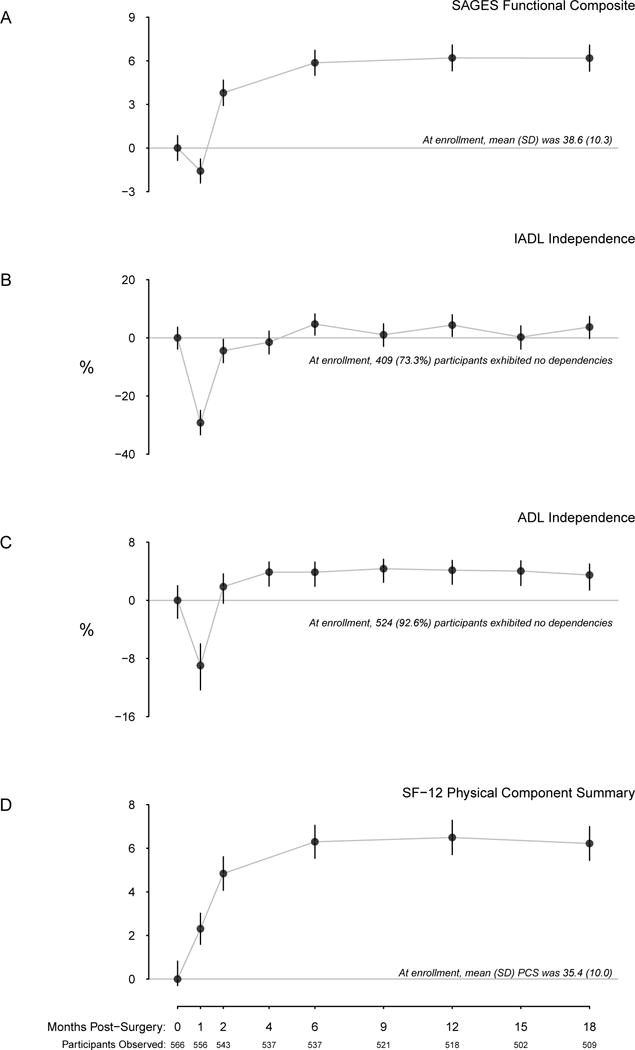
Figure 1.

Change from baseline functional recovery with time, to 18 months. Change in the SAGES functional composite is given in panel A, with horizontal gray line corresponding to zero change. The proportions of individuals exhibiting no IADL or ADL dependencies are depicted in panels B and C, respectively, with the zero line corresponding to no change from baseline. Mean change in SF-12 PCS is depicted in panel D.
