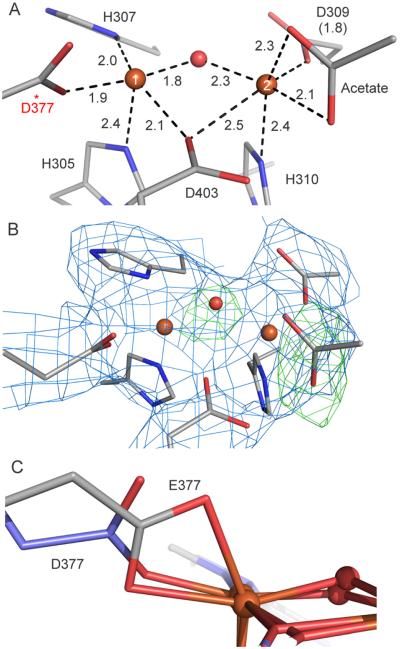
Figure 6.
Details of the diiron active site observed in the X-ray crystal structure of E377D CmlA in the as-isolated state (E377DOx). (A) Bond distances for the iron and first-sphere ligands, given in Å. The mutated residue D377 is starred for clarity. (B) Electron density map of E377DOx. The blue mesh is the 2|Fo|-|Fc| map contoured at 1.0 σ and the green mesh is the |Fo|-|Fc| omit map for the μ-oxo bridge and acetate contoured at +4 σ. (C) Overlay of WTR and E377DOx clusters showing the coordination of residue 377. Atom coloring is as in Figure 1 except the carbon atoms of the variant are shown in purple in panel C.

