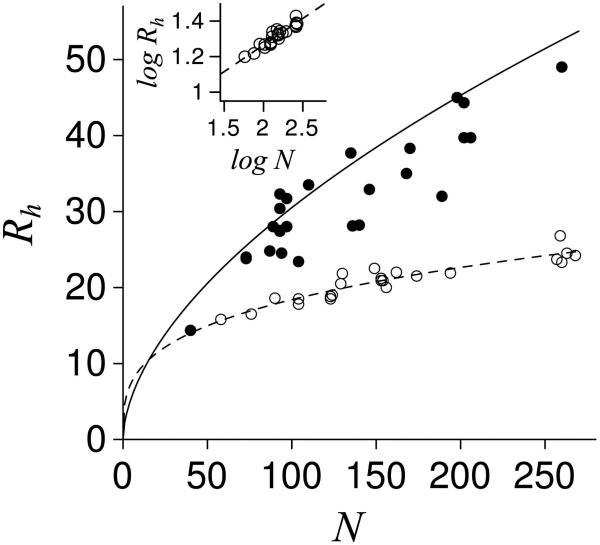
Figure 1.
Rh trends with N in proteins. Solid and open circles are IDPs21-39 and folded proteins,16,40,41 respectively. The trend for folded proteins, Rh = 4.65·N0.30, was determined from the inset plot and is shown by the dashed line. The trend for chemically denatured proteins, Rh = 2.21·N0.57, from Wilkins16 is shown by the solid line. Rh is reported in Å. Inset: Plot of log Rh and log N for the folded proteins, which gave a linear slope and y-intercept of 0.298 (v ~ 0.30) and 0.667 (Ro = antilog (0.667) ~ 4.65), respectively.

