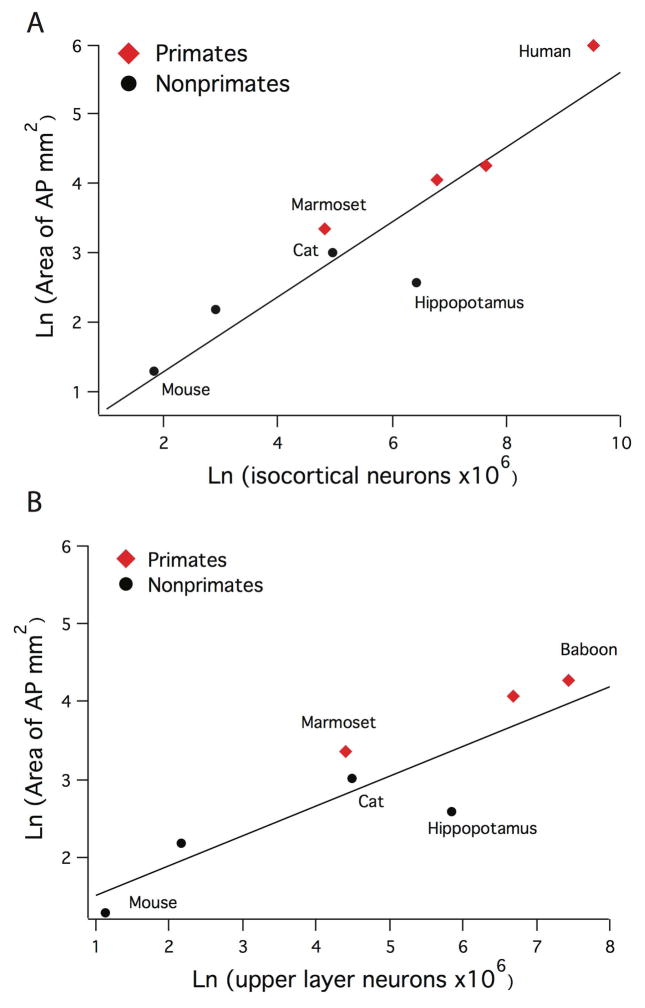
Figure 12.
A) The area of anterior-posterior tracts scale with total isocortical neuron numbers across 8 mammalian species. The human appears to exhibit disproportionately more anterior-posterior corticocortical tracts but our small sample of brains, ranging between 0.5 and 500 g, makes it difficult to conclusively determine whether the large-brained human deviates from the expected allometry of other mammals. B) The area of upper layer neuron numbers scale with upper layer neuron numbers across the studied 7 mammalian species.

