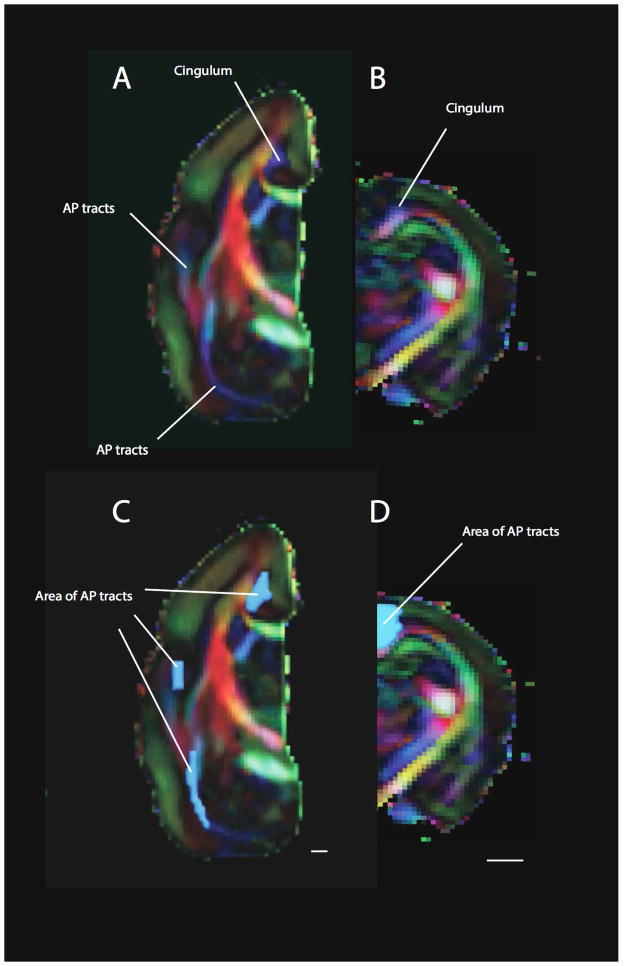
Figure 6.
FA maps can also highlight differences in connectivity patterns between primates and rodents. The FA color maps show vectors aligned along the anterior to posterior axis in blue, vectors aligned along the right to left direction in green and vectors aligned along the top to bottom axis in red. Tracts coursing across the anterior to posterior axis are in blue. A) A number of tracts within the white matter of the cortex course across the anterior to posterior axis (shown in blue) in the marmoset. This is in contrast with the rat (B), where a very small area within the cortical white matter is blue, which represent anterior to posterior cortical tracts. Areas of anterior-posterior corticocortical tracts measured in the white matter of the marmoset (C) and rat (D) are shown. Scale bar: 1mm.

