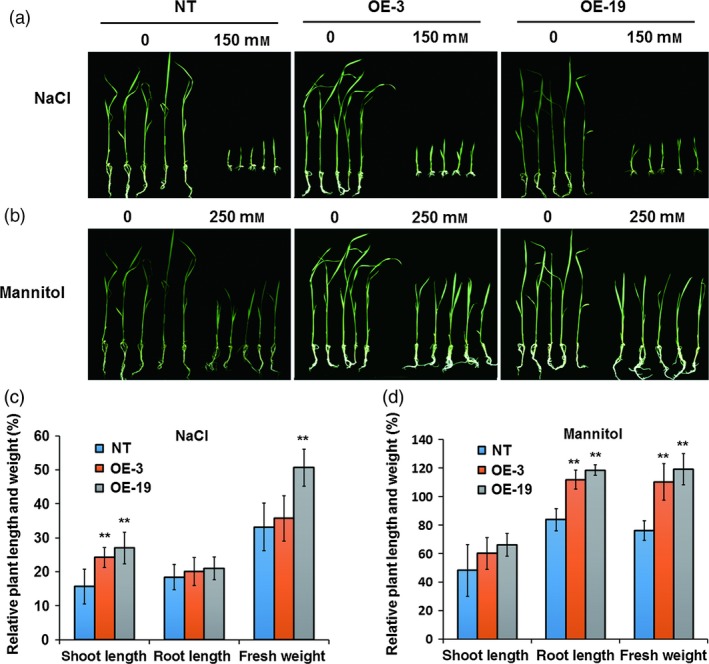
Figure 3.

Increased osmotic tolerance of OsASR5 overexpression plants. (a, b) Growth performance of OsASR5 overexpression and NT seedlings under high salinity and mannitol treatments at the seventh d after transplanting, respectively (n = 3, five plants in each repeat). (c, d) The relative plant length and fresh weight of OsASR5 overexpression and NT seedlings corresponding to a, b, respectively. Data are mean ± SE. ** indicates significant difference at P < 0.01 probability.
