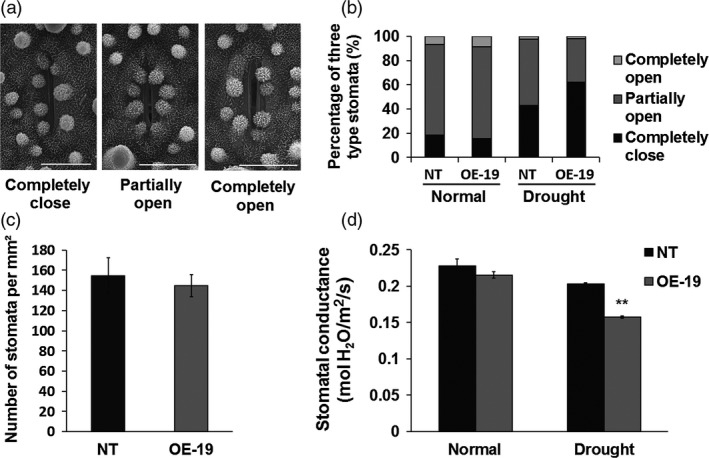
Figure 5.

Overexpression of OsASR5 increasing stomatal closure. (a) Scanning electron microscopy images of three levels of stomatal apertures. Bar, 5 μm. (b) The percentage of three levels of stomatal apertures in the leaves of OsASR5 overexpression and NT plants under normal and drought stress conditions (n = 300 stomata for NT under normal conditions; n = 248 stomata for OE‐19 under normal conditions; n = 322 stomata for NT under drought stress; n = 272 stomata for OE‐19 under drought stress). (c) Stomatal density of the middle leaves of OsASR5 overexpression and NT plants (n = 3). Three random scopes were used in each repeat. (d) Stomatal conductance of OsASR5 overexpression and NT plants (n = 3). Data are mean ± SE. ** indicates significant difference at P < 0.01 probability.
