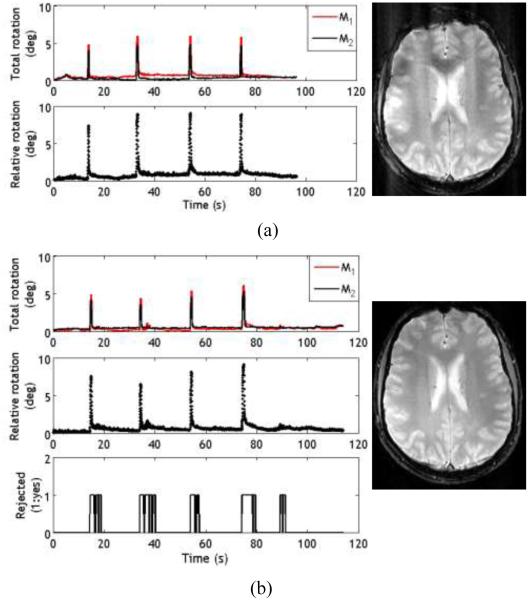
Fig. 7.
Results from experiment 3 with the subject squinting at regular intervals during the scan. a) Plots from the case when the squint detection and reacquisition was disabled. The calculated total rotation and relative rotation are shown. The corresponding image (7a, right) shows the presence of artifacts due to false correction. b) Plots from the scan where squint detection and reacquisition was enabled. A value of 1 in the bottom graph indicates that the scan data was rejected and reacquired (as evident by the increased scan time), resulting in a clear image with significantly less artifacts (7b, right)

