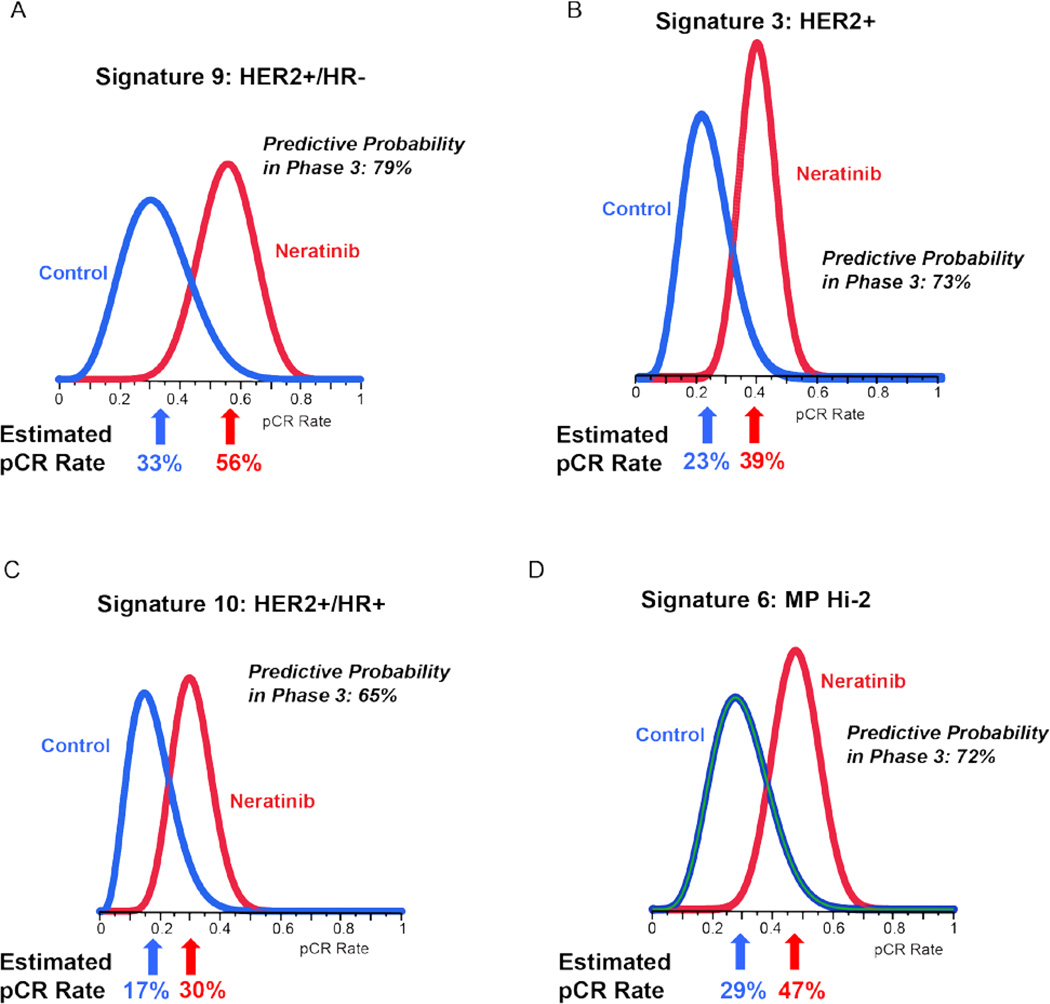
Figure 2. Probability distributions for select signatures.
Histograms showing posterior (final) probability distributions for neratinib and control pCR rates for 4 of the 10 signatures listed in Table 2. Panel 2A is for HER2+/HR−, the graduating signature for neratinib. Estimated pCR Rate is the mean of the respective distribution. Predictive Probability in Phase 3 is a calculation based on the respective pair of histograms and is explained in the text.

