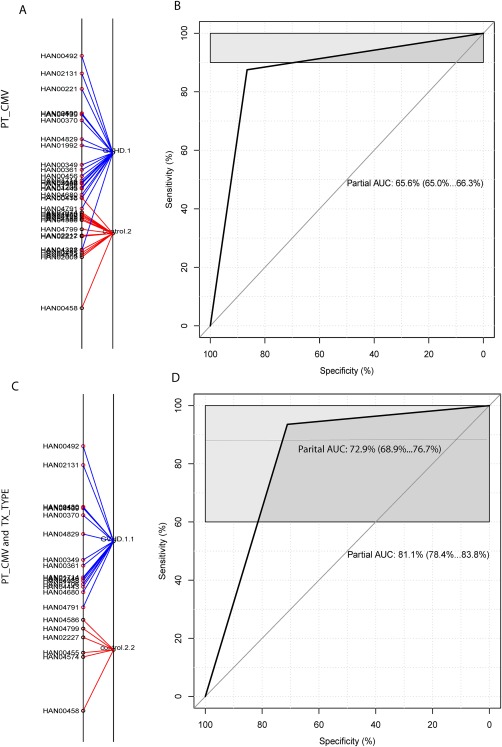
Figure 5.

Discrimination of GVHD against control by three RNA biomarkers combined with clinical variables. (A and B) classification of GVHD versus control by three adjusted biomarkers (IRS2, PLEKHF1 and IL1R2) combined with one clinical variable, patient CMV status. (A) classification of GVHD versus control by using BGA. The suffix number in the phenotype label denotes the CMV status, with 1 and 2 respectively representing CMV negative and positive, so GVHD.1 represents GVHD with negative CMV, and control.2 as CMV positive control. (B) ROC curve derived from three adjusted biomarkers combined with patient CMV status. (C and D) discrimination of GVHD versus control by three adjusted biomarkers combined with two clinical variables, patient CMV and conditioning regimen intensity. (C) discrimination of GVHD versus control by BGA. The second suffix number denotes the type of conditioning regimen intensity, 1‐myeloablative and 2‐non‐myeloablative, GVHD.1.1 as GVHD with CMV negative and myeloablative therapy and control.2.2 as CMV positive control and non‐myeloablative therapy. (D) ROC curve derived from three adjusted biomarkers combined with two clinical variables.
