
Figure 2.
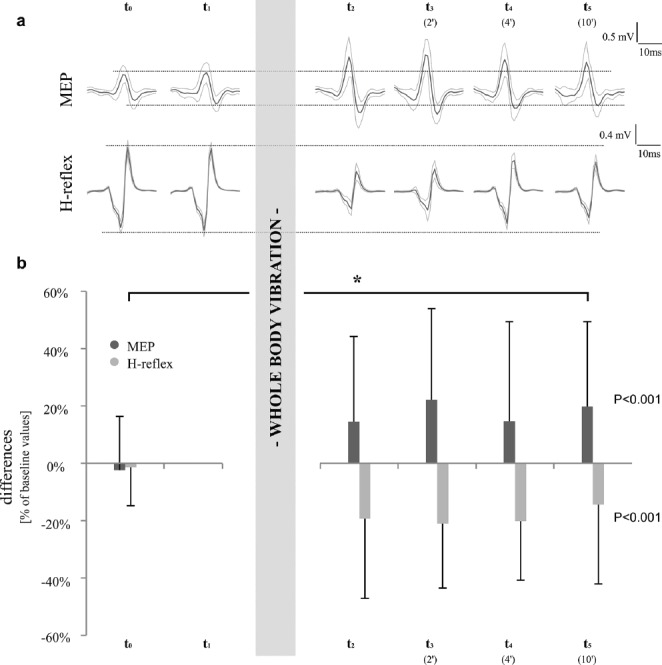
Peak-to-Peak amplitude values of soleus MEP- and H-reflex-stimulation for both protocols for one representative subject (a) and as averaged means±standard deviations (b). Data are presented as differences compared to baseline values (t1), protocol 1 is illustrated in dark columns, protocol 2 in light columns. Significant results (P<0.05) are marked with *.