


Figure 3.
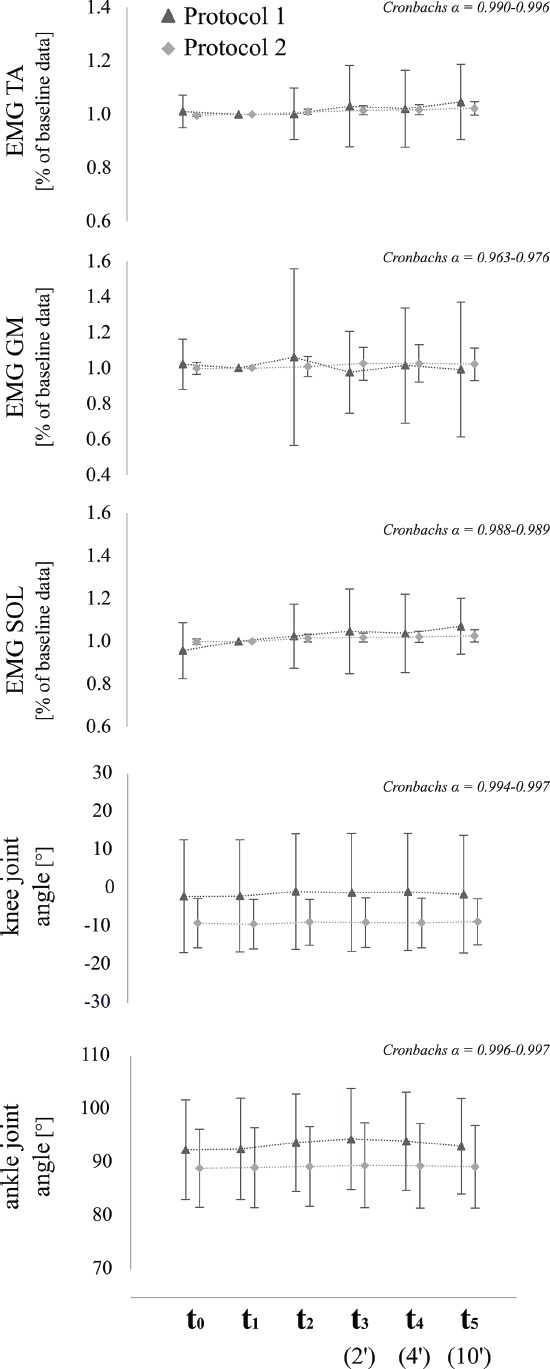
Averaged mean values±standard deviations of EMG (SOL, GM, TA) and kinematic data (ankle & knee joint angles) of both protocols for the respective time point (t0-t5). Values from protocol 1 (MEP) are illustrated with triangles, those from protocol 2 (H-reflex) with squares. ICCs are presented by means of Cronbachs α for each muscle, joint and for both protocols.