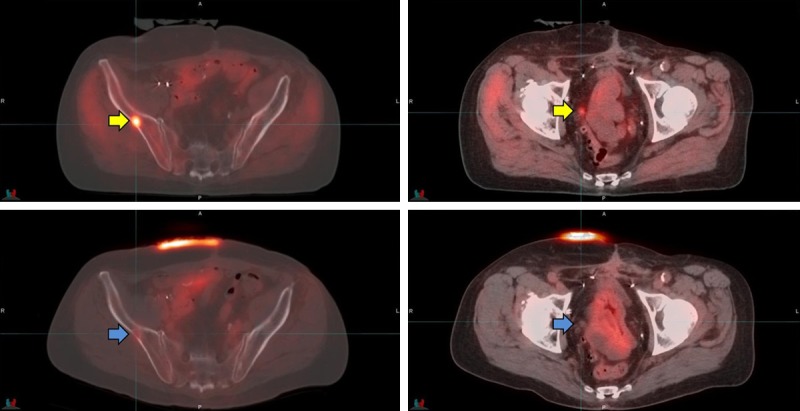
Figure 2.

The patient in the Figure was Gleason 7, post RT 11 years previously now with a rising PSA, 11.15 ng/mL. The top row images show the 11C-Acetate PET with a metabolic focus in right ilium (SUVmax 9.1) and a small right pelvic node (yellow arrows). The lower row images show the 18F-FDG PET in the same patient performed within 23 days. On the 18F-FDG study the lesion in the right ilium is minimally apparent (SUVmax 2.2) and the node in right pelvis is negative for FDG activity above background (blue arrows).
