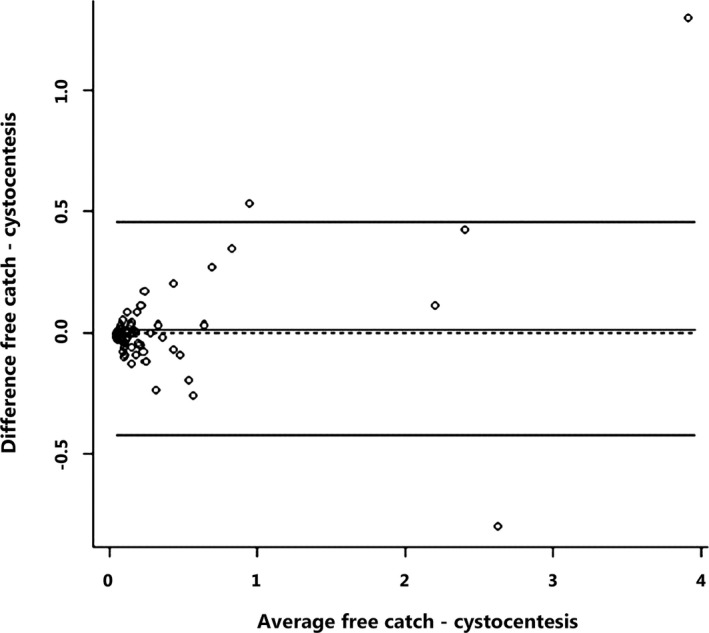
Figure 2.

Bland–Altman plot to assess the level of agreement for urinary protein : creatinine ratio (UPC) measurements between free catch and cystocentesis urine samples (N = 71). Free catch, UPC measurements on free catch urine; cytocentesis, UPC measurements on cystocentesis urine.
