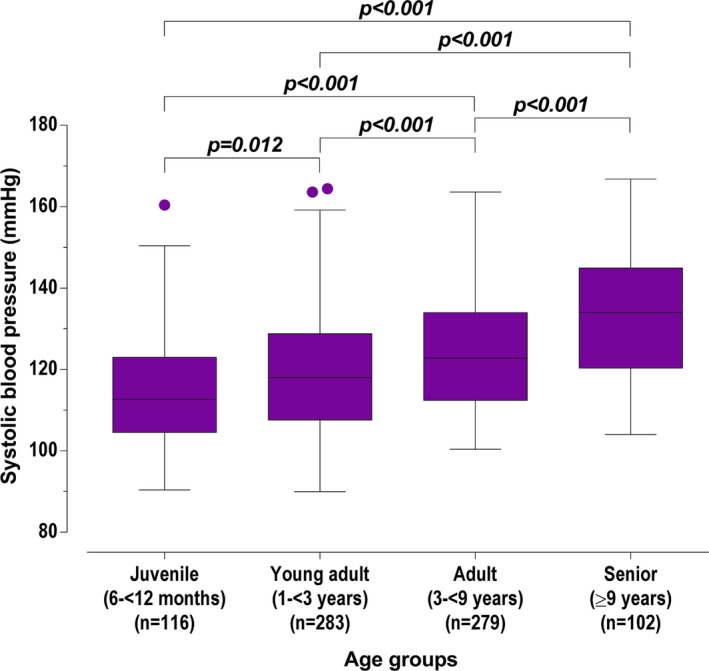
Figure 1.

Box and whisker plots for systolic blood pressure of screened cats, grouped by age categories. Box representing median and IQR, whiskers using the Tukey method (values up to 75th percentile + 1.5 IQR), and dots representing outliers (values greater than 75th percentile + 1.5 IQR).
