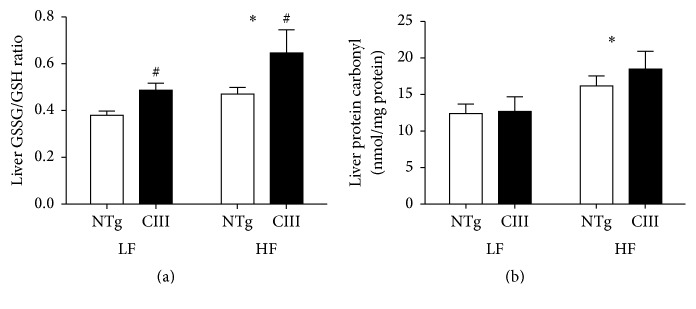
Figure 6.
Effects of apoCIII overexpression and high-fat diet consumption on liver oxidative stress and damage. (a) Liver ratio of oxidized to reduced glutathione (n = 7–9) and (b) levels of carbonylated proteins (n = 6–8) in NTg and apoCIII mice fed either a low-fat (LF) or high-fat (HF) diets for 16 weeks. Data are expressed as the mean ± SEM. ∗LF versus HF group; #NTg versus apoCIII mice (p < 0.05; two-way ANOVA).

