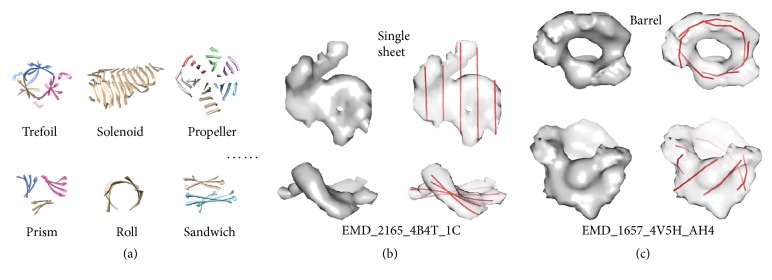
Figure 2.
Challenges of β-structure modeling from cryo-EM density maps. (a) Various β-structures classified in CATH database. (b) An example of an isolated β-sheet density map and the β-traces predicted using StrandTwister. (c) An example of an isolated β-barrel density map and the β-traces detected using the method proposed in this paper. The top view (upper row) and the side view (bottom row) are shown in (b) and (c).

