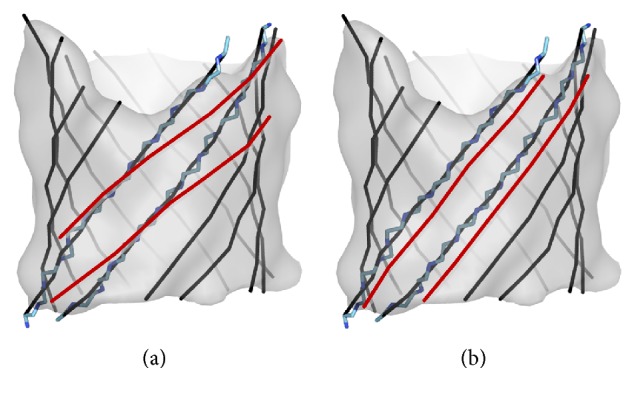
Figure 3.

The problem of β-barrel modeling from medium resolution density maps. A set of β-traces is shown in black lines at the front and gray lines at the back. Two possible sets of β-traces (represented by two black lines and two red lines) may have different orientations shown in (a) or locations/shifts shown in (b). The atomic structure of the two β-strands is superimposed on the two representative β-traces in (a) and (b). Figure 3 is reproduced with permission from IEEE [39].
