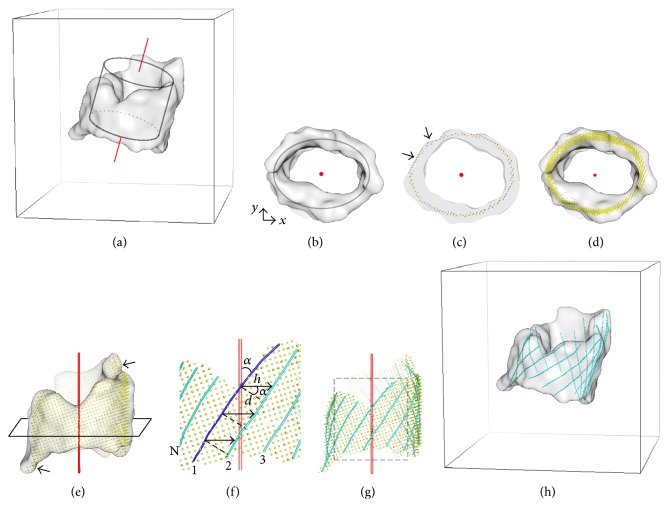
Figure 5.
Generation of β-barrel model and β-traces from a β-barrel density map. (a-b) The barrel axis (red) was identified by fitting an elliptical cylinder to the density map (gray). (c) A cross-section of the barrel shows adjustment (arrow) of the ideal elliptical cylinder model at morphed regions. Top view (d) and the side view (e) of the modeled barrel surface (yellow) show the barrel axis (red) and a cross-section of the β-barrel. The zoom-in view (f) and the entire-view (g) of the β-traces generated recursively on the surface model using tilt angle α and interstrand distance d of β-strands. β-Traces are superimposed with the β-barrel density map in (h). Figure 5 is reproduced with permission from IEEE [39].

