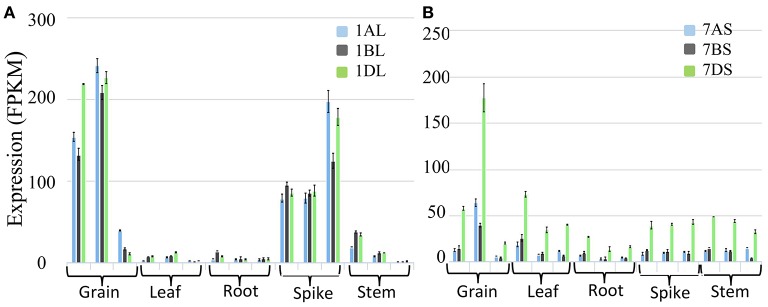
Figure 11.
Expression analysis based on wheat transcriptome data in different tissues (grain, leaf, root, spike and stem) and their development stages. (A) Expression analysis of homoeologous genes for AGPase LS (Transcript id's: Traes_1AL_A1B2A8EB0.1, Traes_1BL_190920E1E.1 and Traes_1DL_844FE40E6.1) on group 1 chromosomes of wheat, and (B) Expression analysis of homoeologous genes for AGPase SS (Transcript id's: Traes_7AS_1B2A8C929.2, Traes_7BS_4FBE4B00A.2, and Traes_7DS_02539EB3B.1) on group 7 chromosomes of wheat.

