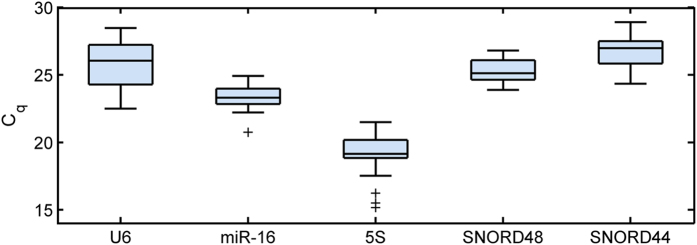
Figure 1. qPCR quantification cycle (Cq) values of the five reference genes in the atrial tissue sample dataset.
For each distribution values are given as median (solid line), interquartile range (IQR, box), lower and superior adjacent values at 1.5 × IQR (whiskers), and outliers (black plus sign markers).

