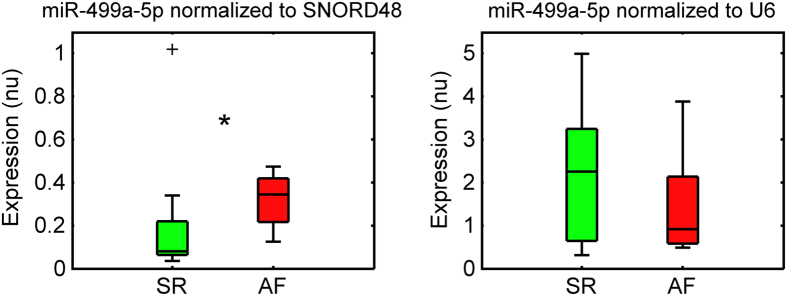
Figure 4. Effects of normalization strategy on miRNA expression profile.
Normalized expressions of miR-499a-5p in sinus rhythm (SR, green box) versus atrial fibrillation (AF, red box) patients, calculated using the best (SNORD48, left) and the worst (U6, right) reference gene. For each distribution values are given as median (solid line), interquartile range (IQR, box), lower and superior adjacent values at 1.5 × IQR (whiskers), and outliers (black plus sign markers). nu, normalized units. *p < 0.05.

