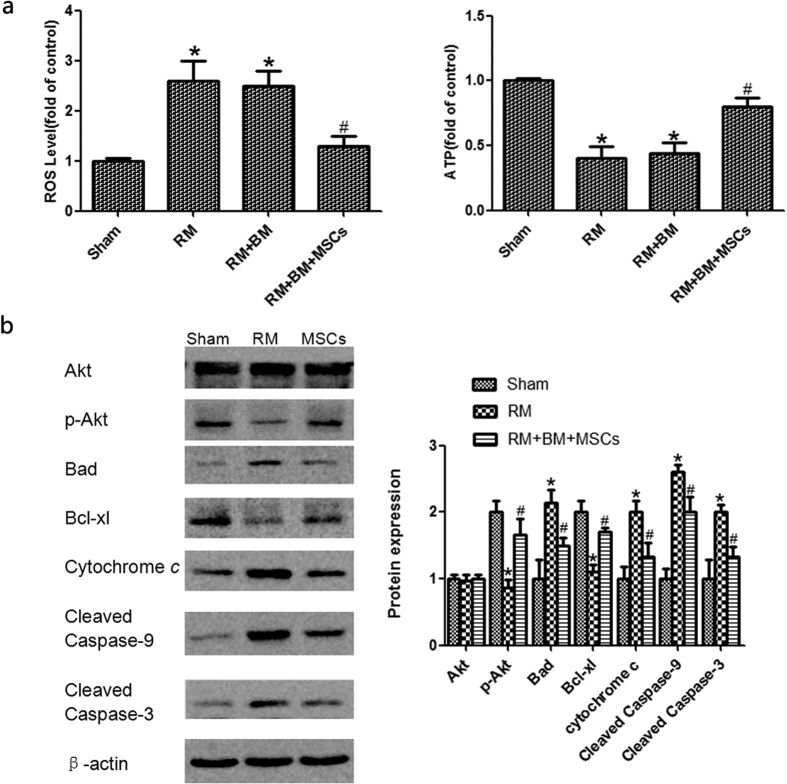
Figure 4. Mitochondrial function changes and p-Akt, Akt, Bad, Bcl-xl, Cytochrome c, cleaved Caspase-9 and cleaved caspase-3protein expression.
(a) Reactive oxygen species (ROS) relative level in renal tubules; and ATP relative level in renal tubular mitochondria. (b) The expression of total Akt protein in each group was at the same level, while p-Akt was significantly lower in the RM group compared with that of the sham group, and p-Akt was significantly upregulated in the RM + BM + MSCs group compared with that of the RM group. Bad, Cytochrome c, cleaved caspase-9, and cleaved caspase-3 were significantly higher in the RM group than in the sham group. MSC treatment significantly reduced Bad, Cytochrome c, cleaved caspase-9, and cleaved caspase-3 compared with the RM group. Bcl-xl was significantly lower in the RM group compared with the sham group, and Bcl-xlwas significantly upregulated in the RM + BM + MSCs group compared with the RM group. Note: *p < 0.05 versus the sham group, #p < 0.05 versus the RM group, n = 6.

