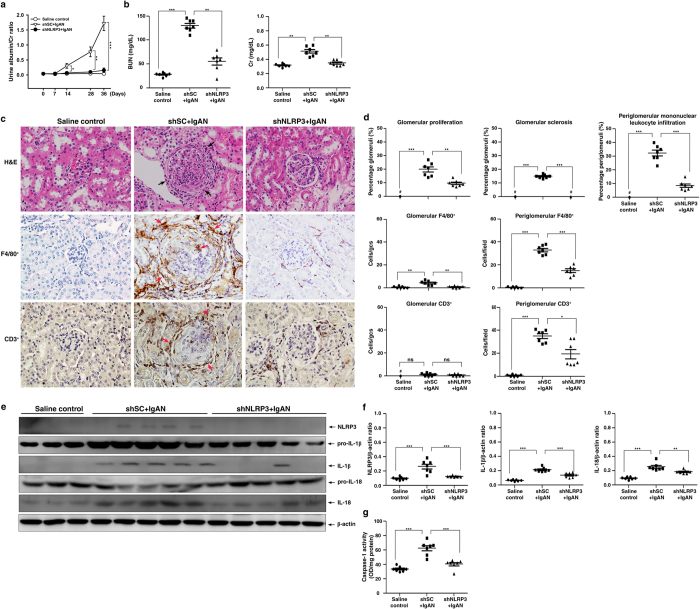
Figure 10. Kidney-targeting shNLRP3 delivery into mice before induction of IgAN.
Urine albumin and Cr ratio on days 0, 7, 14, 28, and 36 (a), serum levels of BUN and Cr on day 36 (b). Kidney histopathology on day 36 [H&E staining] and F4/80+ macrophages and CD3+ T cells [IHC] (c), original magnification, 400x; arrow indicates periglomerular mononuclear leukocyte infiltration or positive staining. Renal lesion scores and scoring of stained cells in the glomerulus and periglomerular region on day 36 (d), NLRP3, IL-1β, and IL-18 protein levels on day 36 (e), a typical result and the semiquantitative analysis for NLRP3, IL-1β, or IL-18 (f), and renal caspase-1 activity (g). The data are expressed as the mean ± SEM for 7 mice per group. *p < 0.05; **p < 0.01; ***p < 0.005. #Not detectable. ns, no significant difference. gcs, glomerular cross section.

