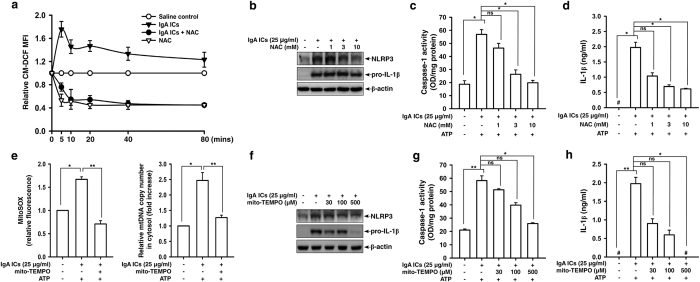
Figure 3. ROS production and mitochondrial homeostasis in IgA ICs-primed macrophages.
ROS levels measured by 2′, 7′-dichlorofluorescein diacetate after incubated for 0–80 min with IgA ICs (a). NLRP3 and pro-IL-1β levels by Western blotting after incubated for 6 h with IgA ICs (b), caspase-1 activation (c) and IL-1β secretion (d) by ELISA after incubated for 5.5 h with IgA ICs and 30 min ATP in J774A.1 macrophages pre-incubated for 30 min with or without NAC. Mitochondrial ROS levels by MitoSOX after incubated for 5 min with IgA ICs and 30 min ATP, and mitochondrial DNA release into the cytosol by real-time RCR after incubated for 5.5 h with IgA ICs and 30 min ATP in J774A.1 macrophages pre-incubated for 30 min with or without mito-TEMPO (e). NLRP3 and pro-IL-1β levels were analyzed by Western blotting after incubated for 6 h with IgA ICs (f), and IL-1β secretion by ELISA after incubated for 5.5 h with IgA ICs and 30 min ATP (g) in J774A.1 macrophages pre-incubated for 30 min with or without mito-TEMPO. The data are expressed as the mean ± SEM for three separate experiments. *p < 0.05; **p < 0.001. #Not detectable. IgA ICs, IgA immune complexes. NAC, N-acetyl-L-cysteine. ns, no significant difference.

