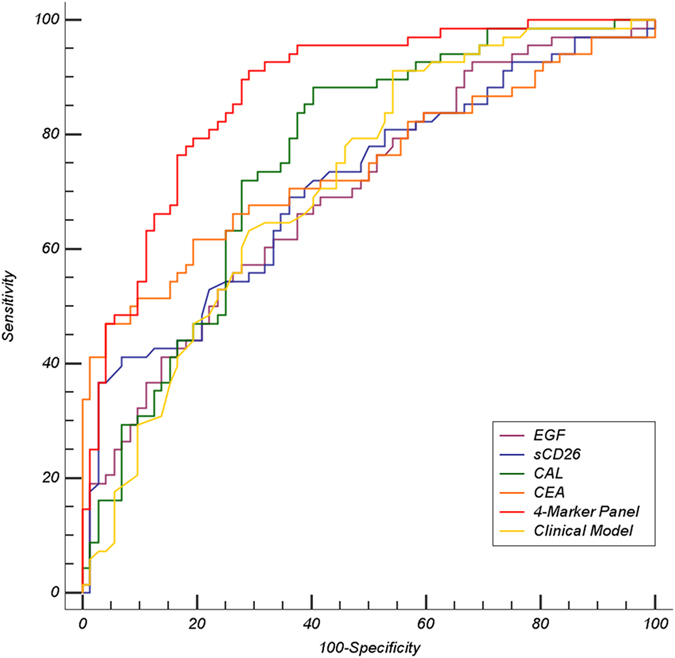
Figure 1. ROC Curve Analysis for Lung Cancer Prediction in the Training Set.

ROC curves are shown for each individual marker included in the classification algorithm, together with the clinical model and the 4-marker panel derived from logistic Lasso regression. Training set included 68 lung cancer cases and 72 controls (36 healthy and 36 benign respiratory pathologies).
