
Figure 2.
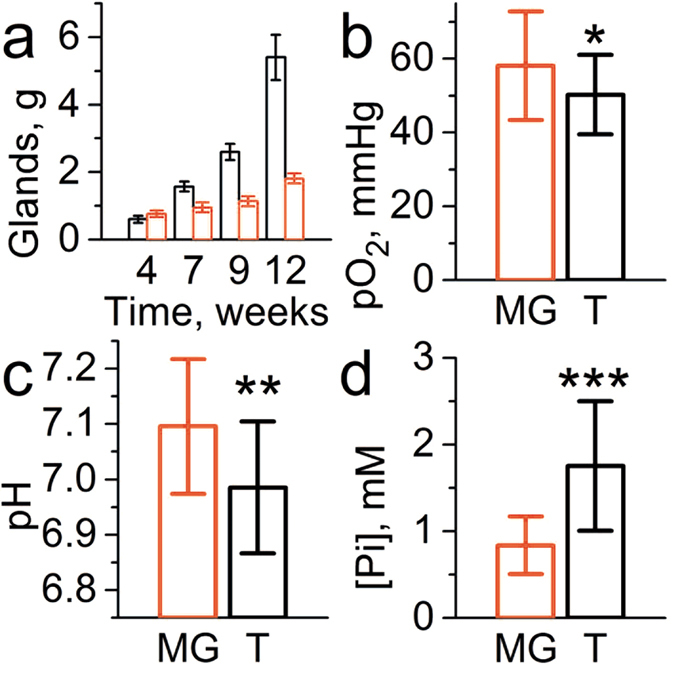
(a) Representative tumor burden (total weight, black columns) of MMTV-PyMT(+) mice (n = 10) and mammary glands (red columns) of their wild type PyMT(−) age-matched littermates (n = 10). The values of pO2 (b), pHe (c) and [Pi] (d) measured in tissue environment of normal mammary gland (MG, n = 23) and tumor TME (T, n = 18). Error bars are SD. *p = 0.065, **p = 0.006, ***p = 6 × 10⁻⁶.