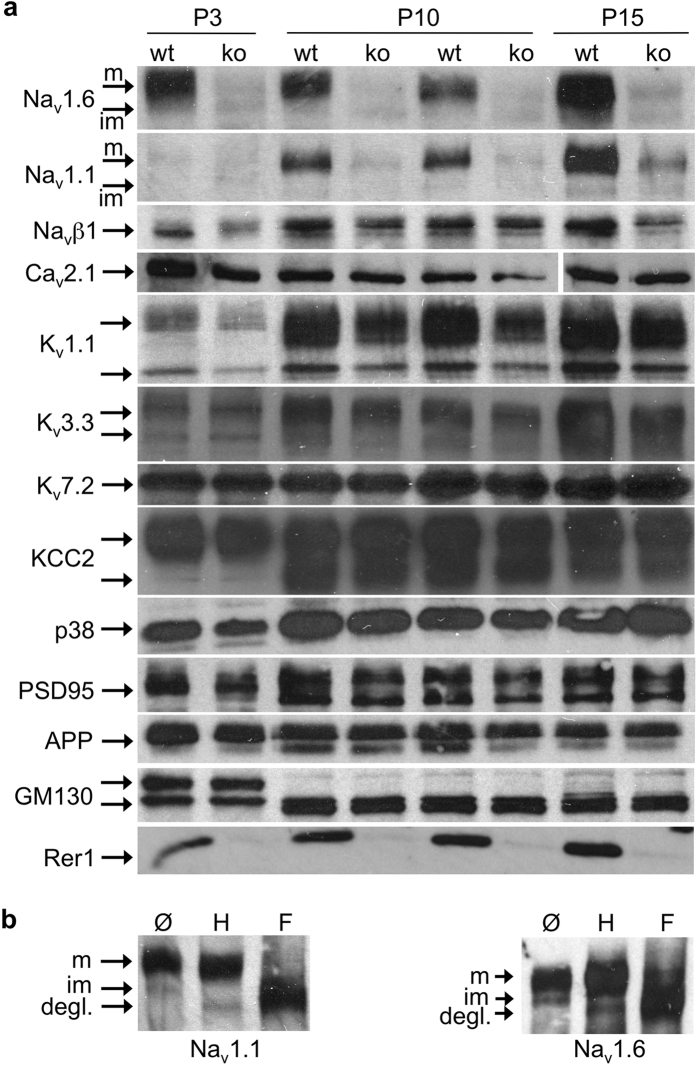
Figure 7. Absence of Rer1 reduces Nav protein levels.
(a) Brain lysates of Rer1Δbrain (ko) and control littermates (wt) of different ages as indicated were separated by SDS-PAGE, blotted and probed with indicated antibodies. In the Cav2.1 blot the irrelevant lane #7 was removed and the two last lanes flipped vertically, to match loading of the other gels. See full-length blot in the supplemental Fig. 5. P38, synaptophysin. (b) De-glycosylation of Nav1.1 and 1.6 indicates maturation status of the different bands. Brain lysates of P15 wt mice were subjected to de-glycosylation with endoglycosidase H (H) or PNGaseF (F) and processed for Western Blotting with Nav1.1 and 1.6 antibodies. Im, immature (endoH sensitive); m, mature (endoH resistant); degl, de-glycosylated Nav1.1 or 1.6 after PNGase F digest. In a, b cropped blots are shown, full-length blots are shown in supplemental Figs 5,6.

