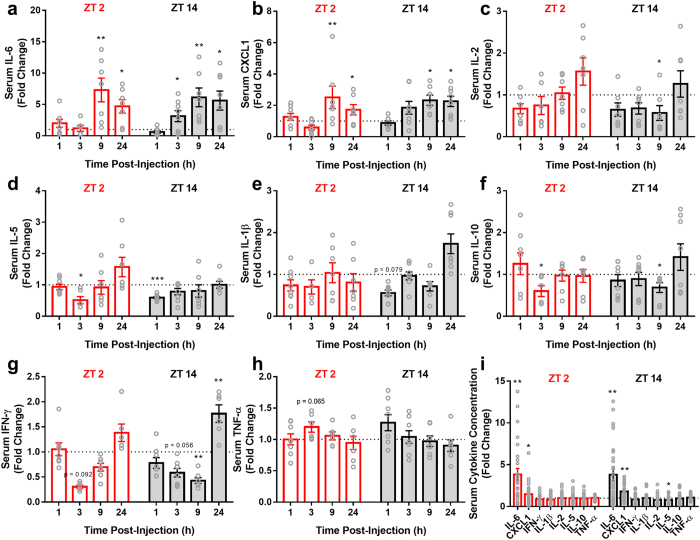
Figure 7.
Serum (a) IL-6 and (b) CXCL1 concentrations were elevated in response to chemotherapy independent of time-of-day. (c) IL-2, (d) IL-5, (e) IL-1β, (f) IL-10, (g) IFN-γ, and (h) TNF-α were unchanged in response to treatment. (i) Average values between ZT 2 and ZT 14-injected animals over the entire post-injection time frame. (N = 4–8/group/timepoint; Error bars represent S.E.M., *p < 0.05, **p < 0.01 compared to the time-matched vehicle average) (the dotted line at y = 1 represents normalized vehicle values).

