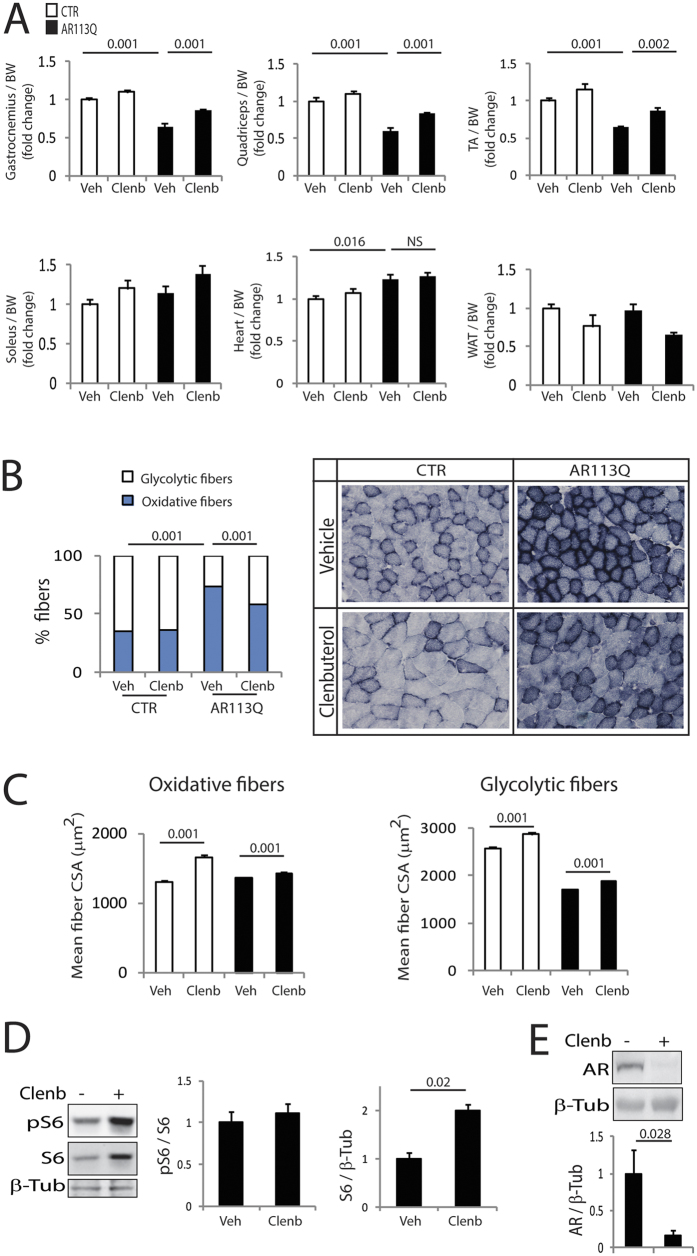
Figure 4. Clenbuterol reduces muscle atrophy and metabolic alterations in SBMA knock-in mice.
(A) Analysis of tissue weight normalized to body weight (BW) of 180-day-old control (CTR, wild type) and AR113Q mice treated with vehicle (Veh) and clenbuterol (Clenb, 2 mg/kg). TA, tibialis anterior; WAT, white adipose tissue. Graph, mean ± SEM, n = 6 CTR-vehicle, 6 CTR-clenbuterol, 8 AR113Q-vehicle, and 6 AR113Q-clenbuterol mice. Two-way ANOVA + SNK. (B) NADH staining of gastrocnemius muscle from 180-day-old AR113Q and CTR mice treated as in (A). Graph, mean ± SEM, n mice = 5 CTR-vehicle, 5 CTR-clenbuterol, 5 AR113Q-vehicle, and 5 AR113Q-clenbuterol, n fibers = 1222 CTR-vehicle, 1034 CTR-clenbuterol, 1810 AR113Q-vehicle, and 1650 AR113Q-clenbuterol. Right, representative images. Two-way ANOVA + SNK. (C) Analysis of the mean oxidative and glycolytic myofiber CSA in the gastrocnemius muscle of 180-day-old AR113Q and CTR mice treated as in (A). Graph, mean ± SEM, n as in (B). Two-way ANOVA + SNK. (D) Western blotting analysis of phosphorylated and total S6 in the gastrocnemius muscle of 180-day-old AR113Q mice treated as in (A). S6 was detected with a specific antibody, and beta-tubulin (β-Tub) was used as loading control. Graph, mean ± SEM, n = 6 mice for each group. Student’s’ t Test. (E) Western blotting analysis of polyglutamine-expanded AR levels in the gastrocnemius muscle of 180-day-old AR113Q mice treated as in (A). AR was detected with a specific antibody, and beta-tubulin (β-Tub) was used as loading control. Graph, mean ± SEM, n = 7 mice for each group. Student’s t-test.

