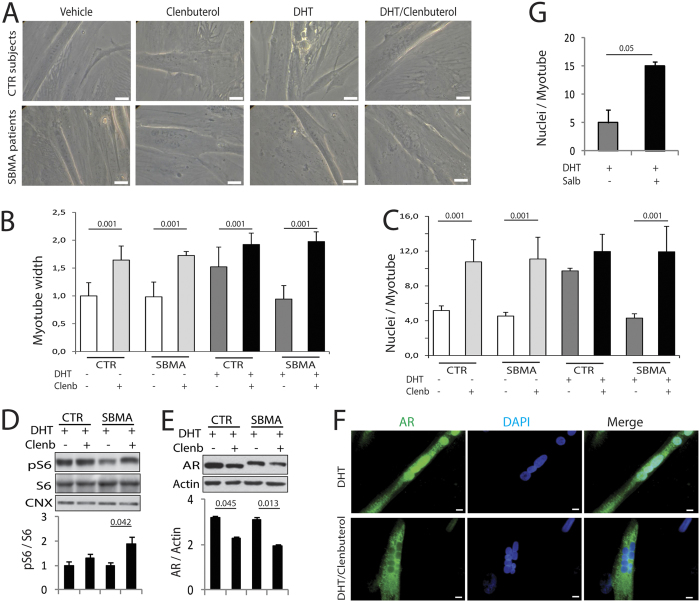
Figure 5. Clenbuterol attenuates the toxicity of polyglutamine-expanded AR in SBMA patient-derived myotubes.
(A) Representative images of myotubes derived from SBMA patients and age-matched normal subjects (CTR) treated with vehicle, DHT (10 nM), and clenbuterol (Clenb, 10 μM) for 10 DIV. Bar, 20 μm. (B) Analysis of the width of myotubes derived from CTR subjects and SBMA patients treated as in (A). Graph, mean ± SEM, n = 3 CTR subjects, 4 SBMA patients. Two-way ANOVA + SNK. (C) Analysis of the number of nuclei/myotube in myotubes derived from CTR subjects and SBMA patients treated as in (A). Graph, mean ± SEM, n = 3 CTR subjects, 5 SBMA patients. Two-way ANOVA + SNK. (D,E) Western blotting analysis of phosphorylated and total S6 and total AR levels in myotubes obtained from CTR subjects and SBMA patients treated as in (A). AR, pS6, and S6 were detected with specific antibodies, and calnexin (CNX) and actin were used as loading control. Graph, mean ± SEM, n = 3 CTR subjects and SBMA patients. Two-way ANOVA + SNK. (F) Immunofluorescence analysis of AR in myotubes derived from SBMA patients treated as in (A). AR was detected with a specific antibody and nuclei with DAPI. Shown are representative images of myotubes derived from 3 SBMA patients. Bar, 10 μm. (G) Analysis of the number of nuclei/myotube in myotubes derived from CTR subjects and SBMA patients treated with DHT (10 nM) and either vehicle or salbutamol (Salb, 1 μM) for 10 DIV. Graph, mean ± SEM, n = 3 CTR subjects, 3 SBMA patients. Student’s t-test.

