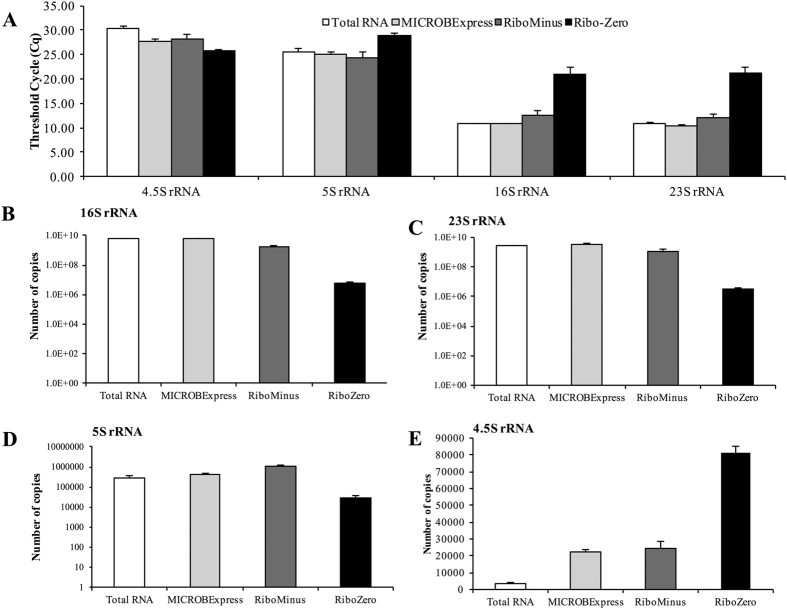
Figure 2. qPCR analysis of rRNA transcript abundance.
(A) qPCR threshold cycle (Cq) for the indicated rRNA transcripts. Copy numbers of (B) 16S, (C) 23 s, (D) 5S, and (E) 4.5S rRNA transcripts were calculated following the establishment of respective qPCR standard curves. cDNA synthesis for the qPCR reactions was performed using 10 ng of indicated RNA samples as input. Experiments were repeated using three biological replicates. Error bars indicate standard deviation.

