
Figure 4.
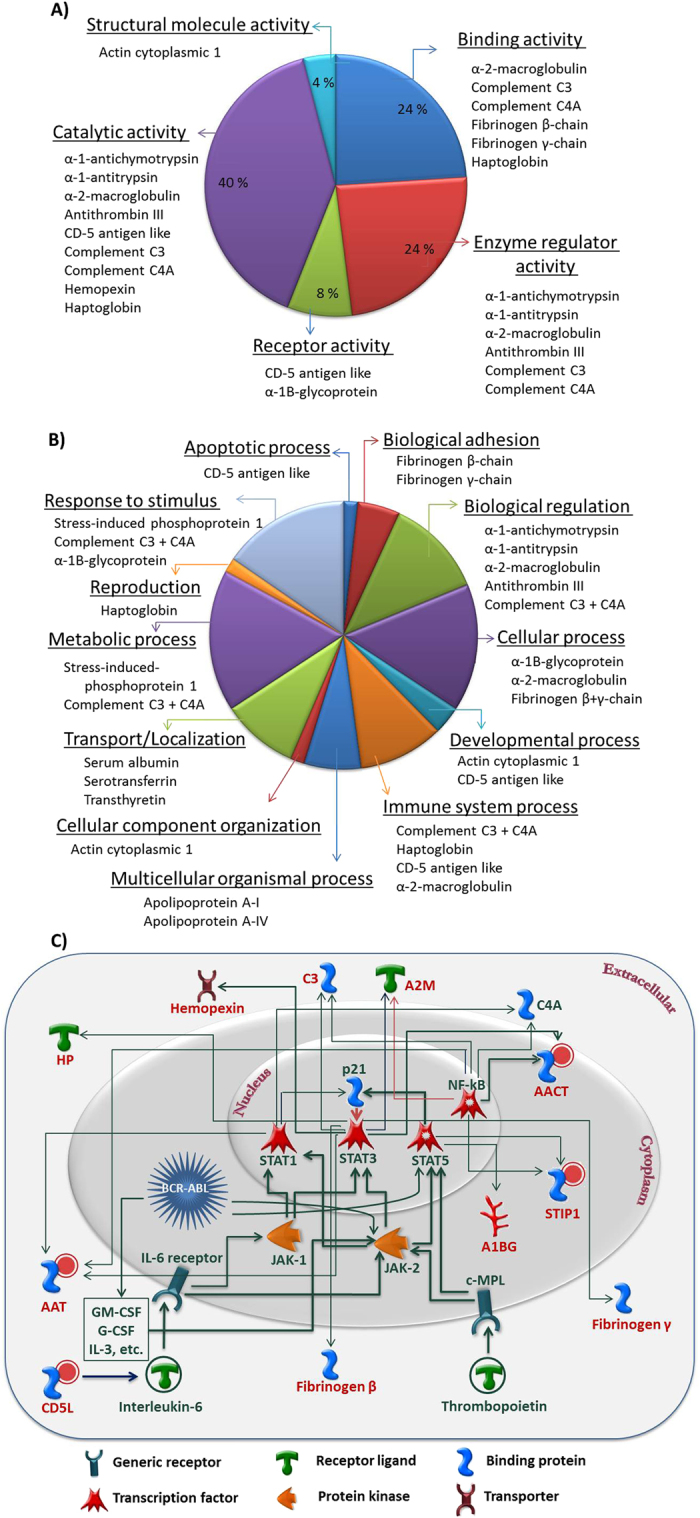
Classification of identified protein according to their (A) molecular functions and (B) biological processes. The assignments are based on Gene Ontology (GO) consortium (www.geneontology.org). (C) Network analysis of the MS identified differentially-abundant proteins in the dataset. The curated pathway is supported by at least one reference in the literature. Individual proteins are represented as nodes where shapes represent the fundamental class to which the proteins belong to. Small circle on-top of the protein symbols (red color) point towards an up-regulated response. Connecting lines between nodes define activation (green) and inhibition (red) while their thickness symbolizes the strength of interaction.