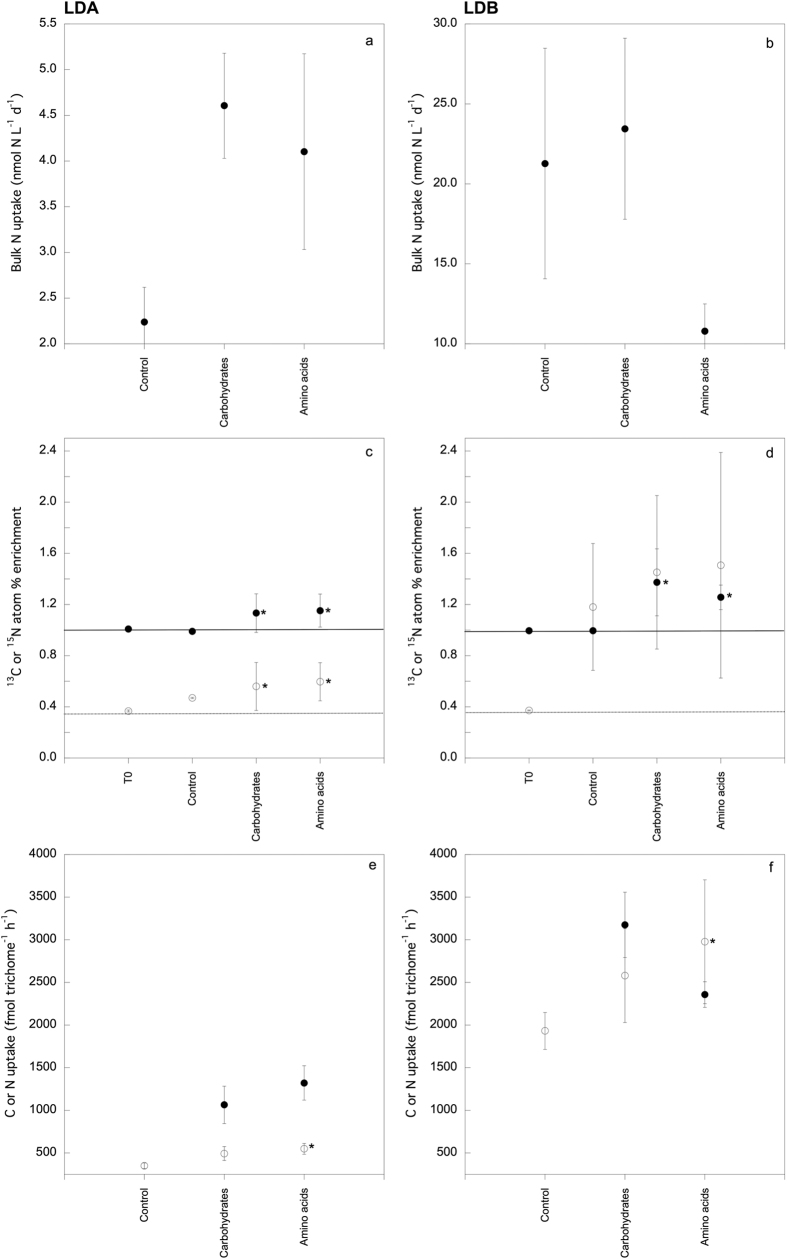
Figure 1.
Bulk seawater N uptake rates at (a) station LDA, and (b) station LDB (note the different scale ranges on the y-axis). Trichodesmium (c,d) 13C -filled circles- and 15N -open circles- atom % enrichment values, and (e,f) 13C and 15N uptake rates at stations LDA and LDB, respectively. Error bars for C or N uptake rates (a,b,e,f) represent the standard error, while error bars for atom % graphs (c,d) represent the standard deviation of the mean. Straight and dotted lines in (c,d) indicate the average 13C and 15N atom % enrichment, respectively, of time zero samples (average natural abundance). Asterisks indicate statistically significant differences (Mann Whitney test, p < 0.05).

