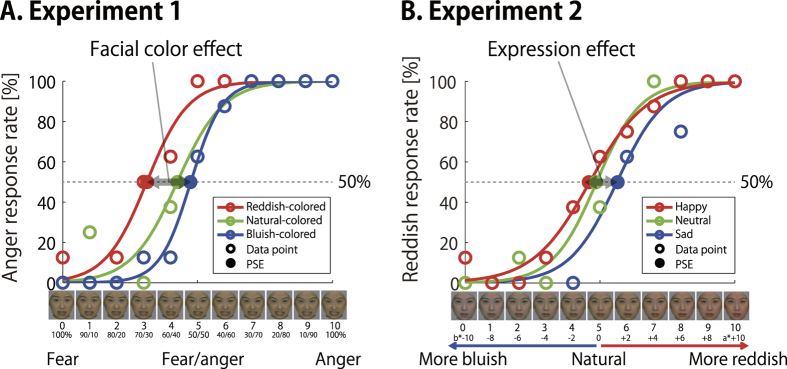
Figure 3. Psychometric function and PSE of a representative participant.
We computed the PSE for each facial color/expression condition to measure the shift in the psychometric function along the x-axis by facial color/expression. (A) An example is shown for fear-to-anger female face continua in used experiment 1. The x-axis shows the morph continuum and the y-axis shows the percentage of time that the participant (Subject H.N.) judged that facial expression as angry. (B) An example is shown for fear-neural-anger female face continua used in experiment 2. The x-axis shows the facial color continuum and the y-axis shows the percentage of time that the participant (Subject H. T.) judged that facial color as reddish. Color images of an emotional face were taken from the ATR Facial Expression Image Database (DB99) (ATR-Promotions, Kyoto, Japan, http://www.atr-p.com/face-db.html).

