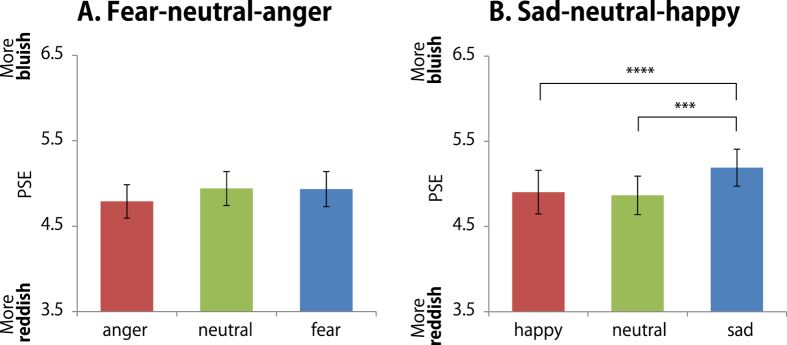
Figure 6. The PSEs for the facial color discrimination task in experiment 2.
(A) Fear-neutral-anger set. (B) Sadness-neutral-happiness set. The error bars show the standard error of the mean of the PSEs across participants. Asterisks indicate a significant difference as a result of a multiple comparison test for a main effect for facial expression; *p < 0.05, **p < 0.01, ***p < 0.005, ****p < 0.001.

