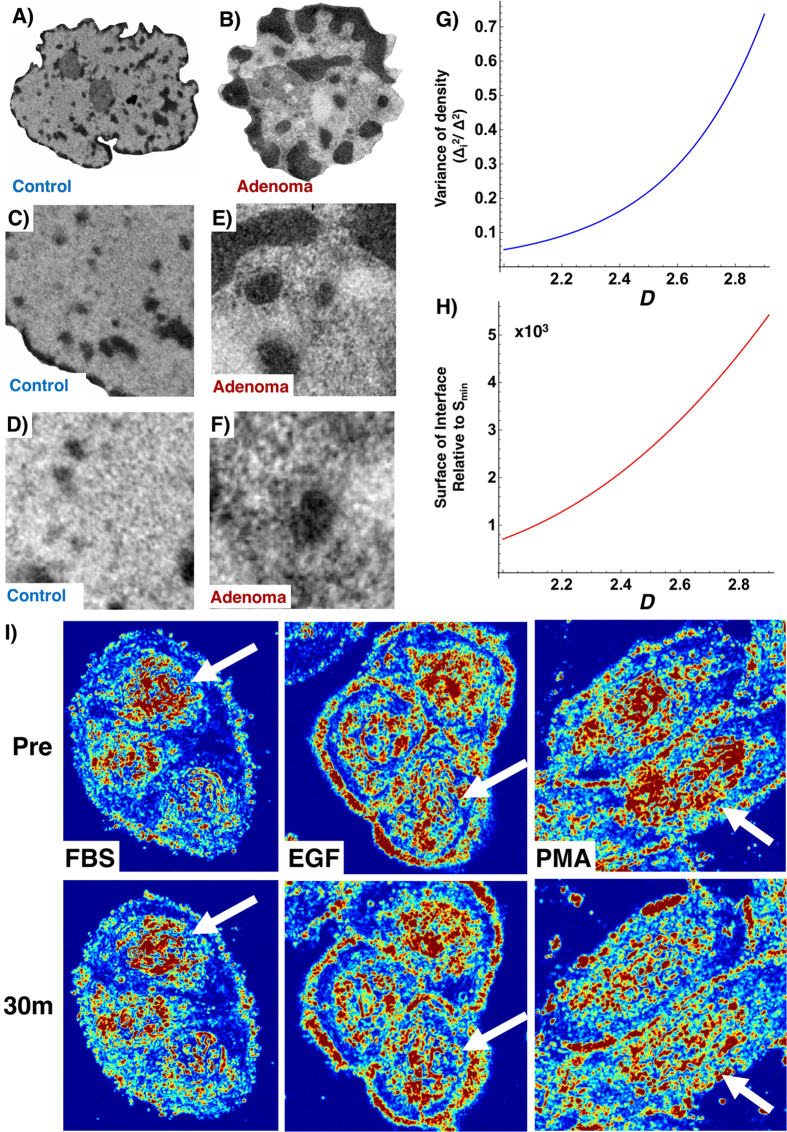
Figure 1. Modeling the physical structure of chromatin topology in early oncogenesis.
(A,B) Transmission Electron Microscopy (TEM) of cell nuclei obtained from histologically normal colonic tissue in patients (Control) without adenoma (A) and from histologically normal colonic tissue in patients with an adenoma at the time presentation (B). (C–F) Representative crop from nuclei of control (C,D) and from adenoma (E,F) patients showing topological variations in nanoscopic mass density distribution qualitatively showing differences in chromatin texture. (G) Quantitative analysis of chromatin topology as a fractal medium shows that increases in D produce an exponential increase in both the surface of the interface (S) relative to the surface of an elementary particle (Smin) and (H) increased variation in the mass density  . Consequently, increases in the accessible surface area within chromatin are coupled with increased focal compaction, and vice versa. To quantitatively study the transformation of physical chromatin topology within the nucleus, the mass density distribution can be modeled as a fractal medium with a characteristic dimension, D and Li = 30 nm. Owing to the characteristic size of chromatin as a fractal globule as measured by Hi-C, the relation between Mmax:Mmin was assumed to be at least 500,000:1. (I) Representative live cell PWS measurements of serum starved HT-29 cells before (Pre) and after 30 minutes after (30 m) treatment with serum (FBS), epidermal growth factor (EGF), and PMA (PMA). Arrows indicate representative nuclei.

