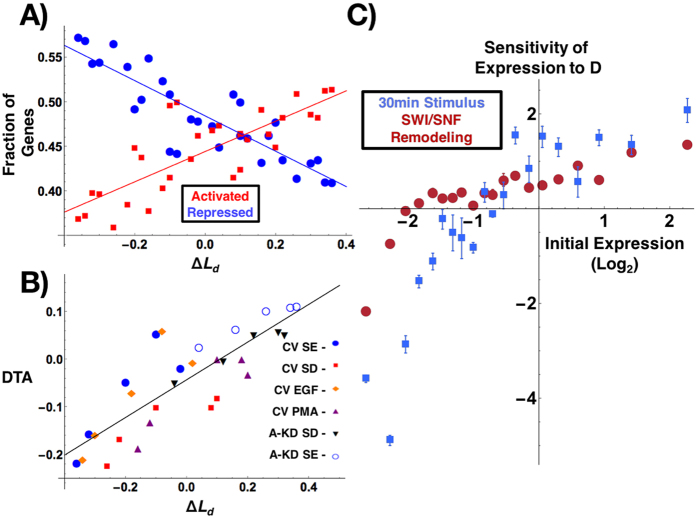
Figure 2. Relationship between chromatin physical topology and differential gene expression.
Four growth conditions were used for control vector (CV) HT-29 cells: Serum Enriched (SE), Serum Depleted (SD), EGF stimulated (EGF), and PMA stimulated (PMA). Further, knock-down was performed on the SWI/SNF chromatin remodeling enzyme Arid1a and grown in SE (A-SE) and SD (A-SD) conditions. As ∑ and Ld are linear functions of D, PWS microscopy was used to measure nanoscopic changes in chromatin physical topology corresponding to a change in D. (A) Microarray analysis of gene expression as a function of ΔLd for differentially expressed genes shows a linear correlation with fraction of upregulated genes (Activated, R2 = 0.63) and fraction of suppressed genes (Repressed, R2 = 0.75) as D increases. (B) Quantification of the summative effect on global expression was performed by calculating Differential Transcriptional Activity (DTA = Activated − Repressed) showing a monotonic increase in the fraction of genes overexpressed as ΔLd increases independent of the comparison groups. Comparisons were made between the initial state (see legend) and all other groups. R2 for each comparison >0.78, and 0.70 overall. (C) Calculation of the sensitivity of expression for genes organized as a function their initial expression in normal growth SE conditions for the SWI/SNF conditions (CV-SD, CV-SE, A-SD, A-SE) and within 30 minutes of treatment using live cell PWS microscopy (CV-SD, CV-SE, EGF, PMA). Sensitivity is calculated as the relative rate of change in expression for a gene as a function of D measured through the change in Ld or ∑ with the errorbars representing the standard error from four experimental replicates (see Methods). A positive sensitivity indicates that as D increases a given gene is more likely to have an increased expression. Conversely, a negative sensitivity indicates that expression of a given gene is more likely to decrease. The magnitude of the sensitivity indicates the amplitude of the expected change as a function of D.

