
Figure 2. Quantitation of Ras isoform expression in adult tissues.
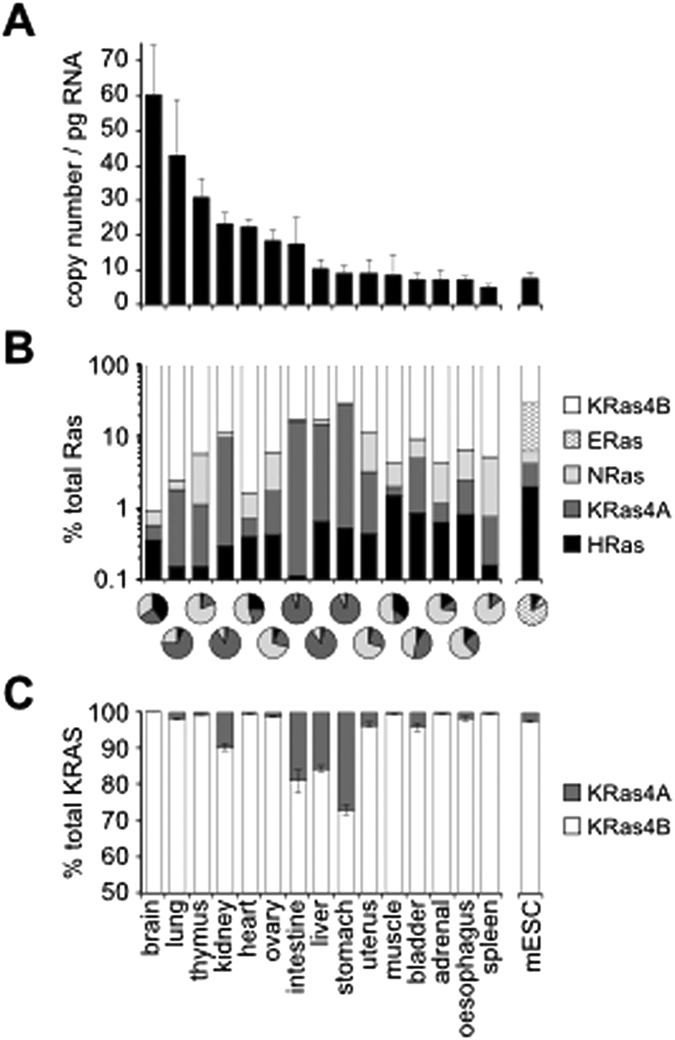
(A) Total Ras expression summed from qRT-PCR quantitation of HRas, KRas4A, KRas4B, NRas and ERas. (B) Analysis of the relative expression of Ras isoforms indicates that KRas4B represents 70–99% of total tissue Ras mRNA transcripts. Histogram employs log scale to show contribution of minor isoforms. Pie charts show the relative expression of all Ras isoforms except KRas4B. (C) Contribution of KRas4A and KRas4B to total KRas expression. n = 3 adult mice per tissue, n = 3 R1 mESC cell samples.