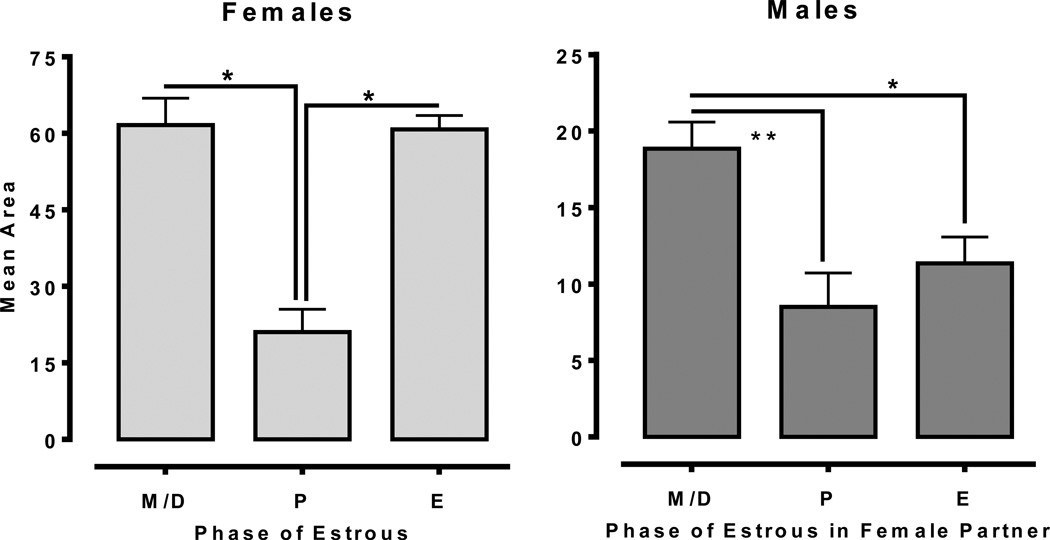
Fig. 5.
Area under the curve values derived from the heroin dose-response curve in Experiment 3. Data were calculated using the trapezoidal rule. Females (n=5) show significant reductions during proestrus (P) compared to other phases. Males (n=5) had significantly lower values during both proestrus (P) and estrus (E) compared to meta/diestrus (M/D) of their female partners (*<.05; **<.01). Please note difference in Y-axis between males and females.

