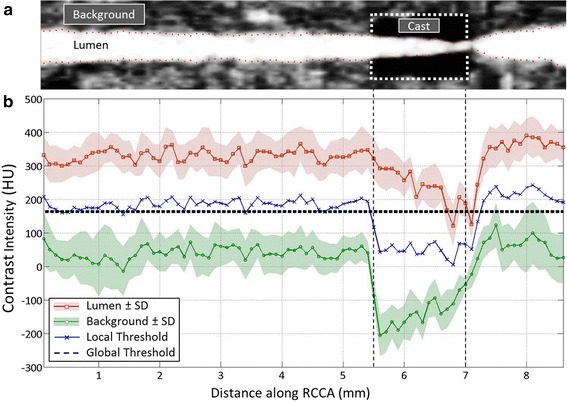
Fig. 3.

a Illustration of the RCCA with cast on micro-CT using eXIA 160. b Contrast intensity along the RCCA using eXIA 160. Lumen region is shown in red line with square markers; Blue line with cross markers represents the local threshold; Black dashed line indicates global threshold value; Background region is marked as green line with circles; Standard deviation is indicated by shadow areas
