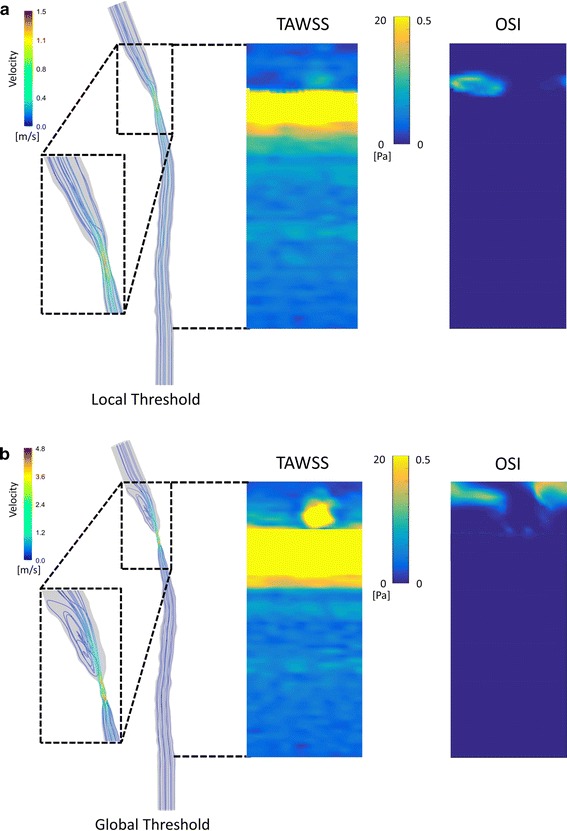
Fig. 7.

a Hemodynamic analysis of shear-manipulated RCCA using vessel geometry created from the local threshold method. Streamline (left panel) representing velocity field along the RCCA; TAWSS (middle panel) and OSI distribution (right panel) along the RCCA. b Hemodynamic analysis of shear-manipulated RCCA using vessel geometry created from the global threshold method. Streamline (left panel) representing velocity field along the RCCA; TAWSS (middle panel) and OSI distribution (right panel) along the RCCA. The range of the colormap is between 0 and 20 Pa
