
Fig. 3.
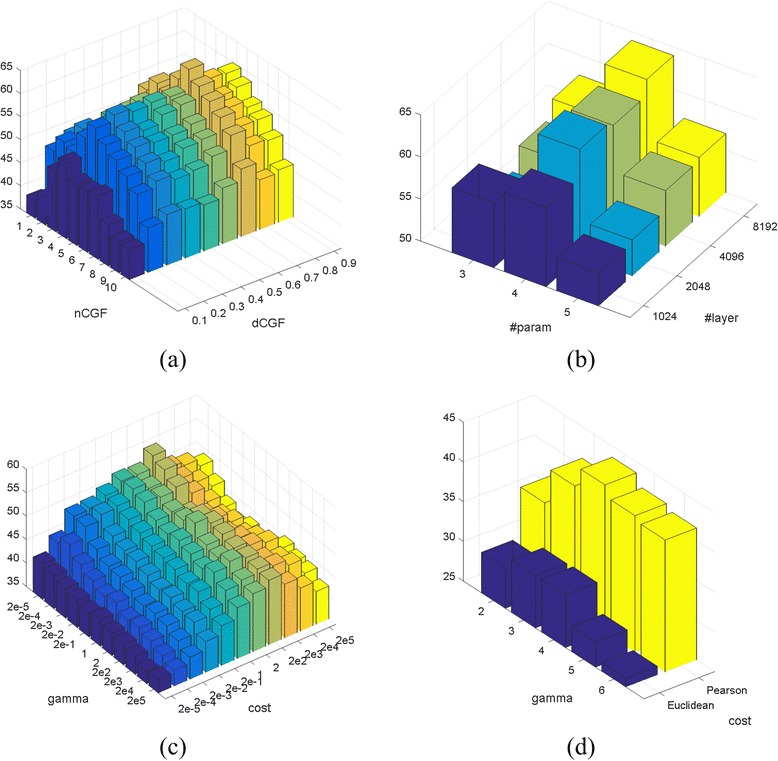
3D bar-plots of parameter estimations for sensitivity review. The Z-axis stands for 10-fold cross validation accuracy. a Parameter estimation for d CGF and n CGF, corresponding to Table 4; b parameter estimation for layer number and parameter number per layer for the DNN classifier, corresponding to Table 5; c parameter estimation for cost and gamma for SVM, corresponding to Table 6; d parameter estimation for Table 7