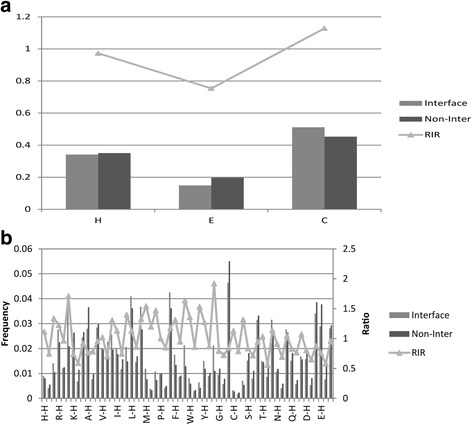
Fig. 2.

Comparison secondary structure and residue preference between interfaces and non-interface surfaces. The frequencies of secondary structure and residues on interface and non-interface surface are shown in gray and black columns, respectively. The RIR is shown in triangle and line. a Secondary structure composition and RIR. The x-axis is secondary structure types (H:helix, E:strand, C:coil). The y-axis is frequency and relative interface ratio value. b Composition and RIR of 60 classes residues. The x-axis is residue types (secondary structure combined with amino acid). The main y-axis is residue frequency and secondary y-axis is relative interface ratio (RIR)
